June 6, 2019

Merlin

Macro Economic Risk of Loss INdicator M.E.R.L.I.N

Combining Equity, Macro and Credit Risk Factor Models to Determine a View of Market Risk

To inquire about free access to the MERLIN dashboard, click below.

Q1 2020 Update:

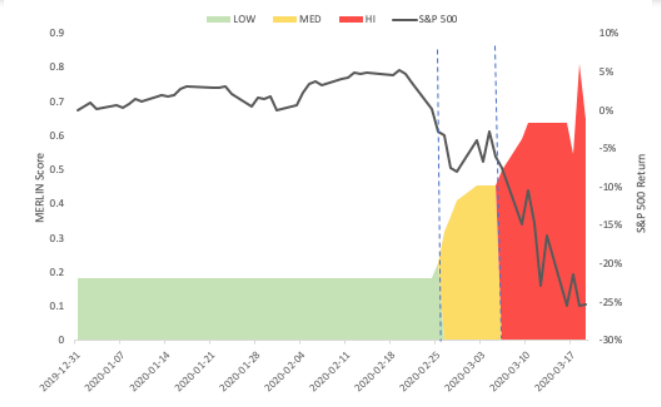
How Did Our Tail Risk Indicator do?  In the face of an unprecedented global selloff in risk assets, MERLIN did an excellent job of signalling a true “tail risk” event by the end of February.  Read the full article to see how it’s performed in other historical drawdowns.
Our Philosophy

Life is about modeling expected outcomes…  

Financial markets are no different.  Just as the natural world provides clues about the underlying order of things, so too do the markets and the economy.  While it has been said that modern-day humans are drowning in data but starved for information, with M.E.R.L.IN, we distill that data into actionable insights about future states of the world.

M.E.R.L.IN Tail-Risk Score

The IDX MERLIN Tail-Risk Model dynamically weights various equity, credit and macro variables to determine current levels and directional trends of each portfolio risk factor.

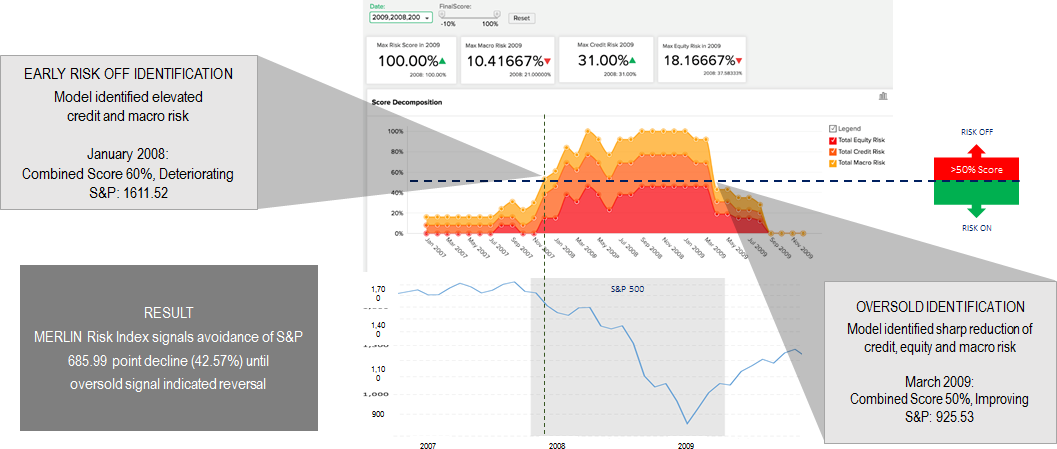
Each variable is (1) evaluated relative to its historical distribution, and (2) whether it’s improving or deteriorating. This determines whether each variable is signaling a “Risk” state or a “Non-Risk” state.

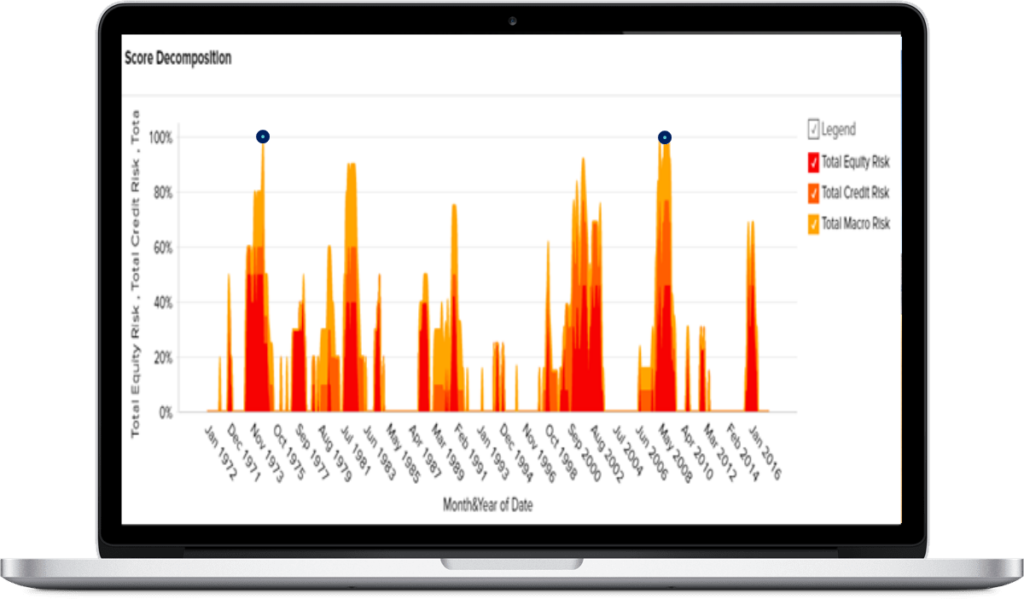
The total risk score is the percentage (%) of indicators (Equity, Credit, Macro) that are currently signaling a “Risk” state. Risk levels greater than 50% indicate that more than half of the variables are signaling a “Risk” state, which has historically correlated with a higher likelihood of realized market drawdowns. Extreme conditions, while rare (circled), indicate periods of market capitulation and thus cause the risk score to de-escalate at an above average rate.

IDENTIFYING TURNING POINTS

The result is an easy to interpret indicator, that’s updated daily and offers full transparency into the underlying risk-drivers.
Disclaimer

IDXINSIGHTS

The content provided on this website is informational, subject to change and is not investment advice or any offer or solicitation for the purchase or sale of investments.  Any use of this content is subject to and evidence of the user’s acceptance of all important legal disclosures, disclaimers, terms of use and provisions found at www.idxinsights.com/legal, including the user’s complete release of liability for any use of the content, which may contain inaccuracies. 

Unless otherwise noted, performance information is hypothetical and GROSS of all associated fees and sales and trading expenses that an investor might incur.  You cannot invest directly in an index.  Hypothetical or model performance results have certain limitations including, but not limited to: hypothetical results do not take into account actual trading and market factors (such as liquidity disruptions, etc.).  Simulated performance assumes frictionless transaction costs and no lag between signal generation and implementation. Simulated performance is designed with the benefit of hindsight and there can be no assurance that the strategy presented would have been able to achieve the results shown.  There are frequently large differences between hypothetical performance results and actual results from any investment strategy.  While data was obtained from sources believed to be reliable, IDX Insights, LLC (“IDX”) and its affiliates provide no assurances as to its accuracy or completeness.

By clicking ACCEPT you acknowledge that you are a financial professional