

The last 2 months have seen an unprecedented selloff across global markets. While many investors entered 2020 expecting more volatility going forward, the speed and magnitude of this liquidation were truly characteristic of a “tail-risk” event.
The exogenous nature of the catalyst (a viral pandemic) coupled with richly valued asset classes combined to create a sell-off that combined the worst elements of 9/11 and 2008.
That said, this event has presented an excellent, real-time, opportunity to observe how our Macro-Economic Risk of Loss INdicator (M.E.R.L.IN) interpreted these events. But before we look at the 2020 selloff, let revisit how MERLIN deciphered draw-downs of the past.
MERLIN Scores for Dot Com Bubble and 2008 Financial Crisis
Every day, MERLIN pulls data from several sources (market data, Federal Reserve, etc.) and prints a score from 1-100. This can broadly be interpreted as the suggested hedge ratio. A score of 30% means an equity portfolio should consider hedging out 30% of the risk. Scores above 50% suggest a strong “risk-off” posture (i.e. our “Red Zone”). Below are MERLIN scores from January 2000 – July 2003:
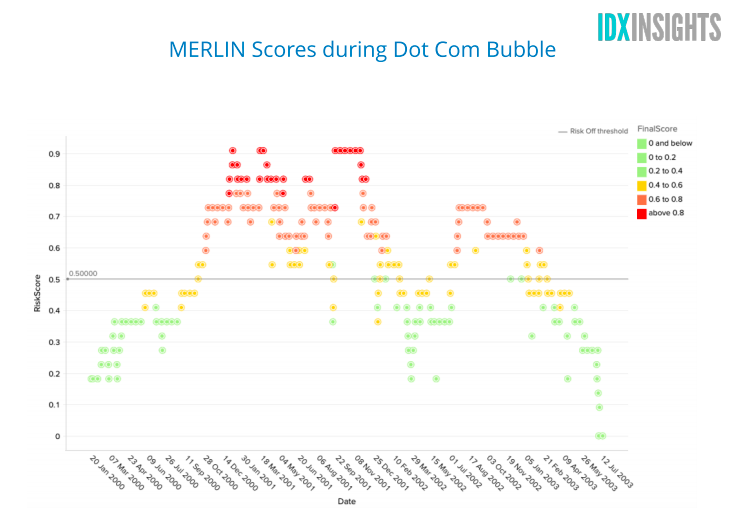
MERLIN entered 2000 at 18%, and first crossed the 50% Risk Off threshold on October 12, 2000. The Risk Score dipped below the 50% level a couple of times, in September of 2001 (remember, Q4 was positive in 2001) as well as early 2002, only to jump back into Risk Off territory, and finally settling below the threshold in February of 2003.
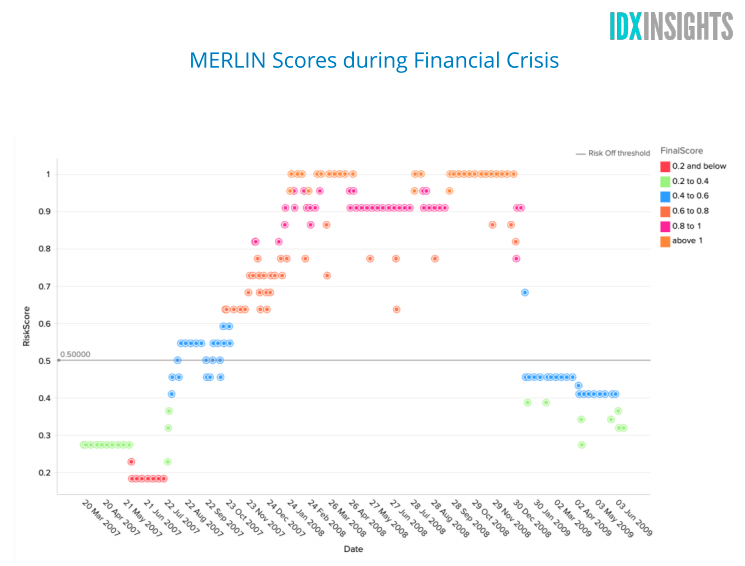
During the Great Recession, MERLIN first rose above the 50% risk threshold on August 9th 2007, and aside from a few dips to 45% in September and October of ’07, did not cross back into Risk-On territory until January of 2009. This may have been a bit early, but notice the scores for the first half of 2009 were still around the 40% level.
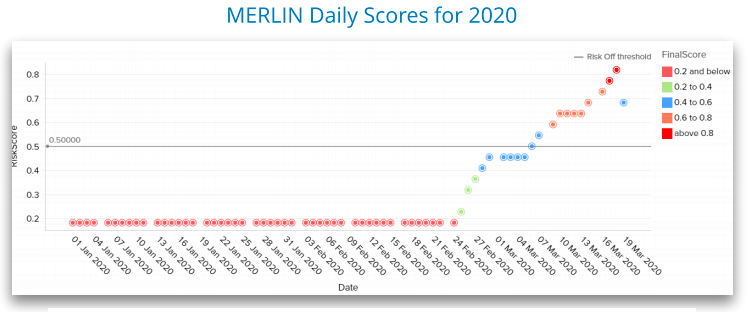
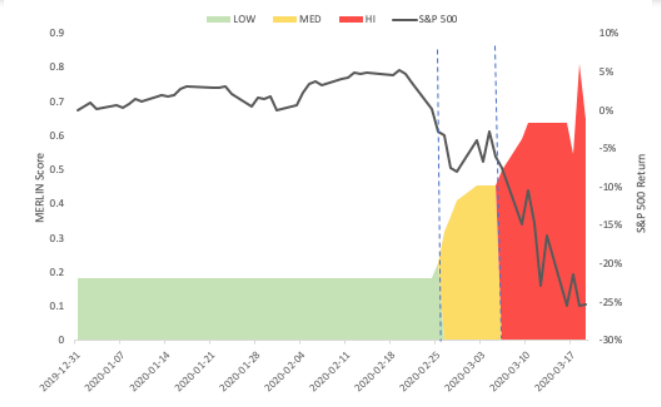
MERLIN Scores in 2020
MERLIN entered 2020 at 18% and began increasing steadily starting on the 25th of February. It crossed the 40% line on February 28th, and the 50% Risk-Off threshold on March 6th. Today MERLIN sits at 68%, still well within the high risk zone.
MERLIN is a tool that we provide to our institutional and RIA clients. While no model can (or should attempt) to signal market “tops” or “bottoms”, having a systematic process to interpret multiple market and (importantly) non-market indicators can be extremely useful for de-risking portfolios in a robust, rules-based fashion.
Daily Data going back to 1970 is available. To learn more about MERLIN and how to access this research, please contact Ben Jacobson at benjacobson@idxadvisors.com or 951-541-3959 or schedule time below.