Originally published at Palladiem
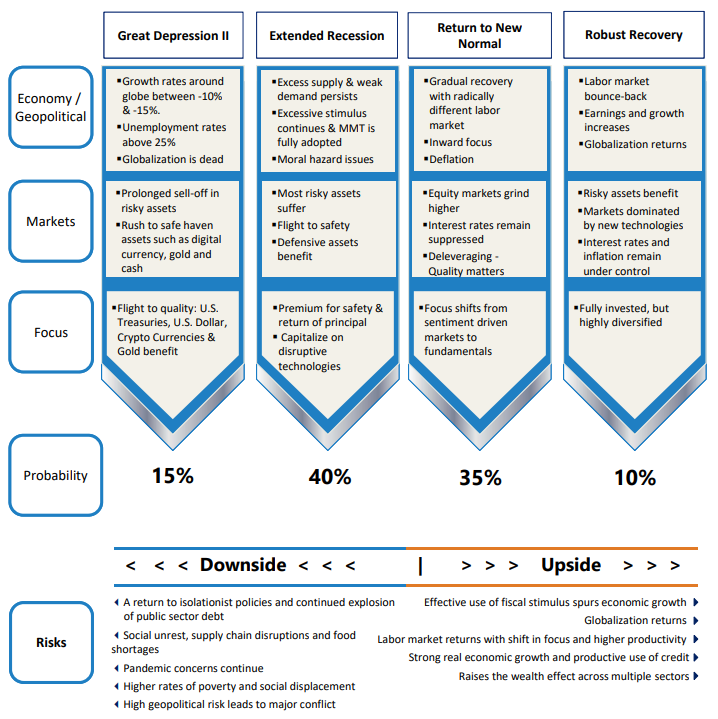
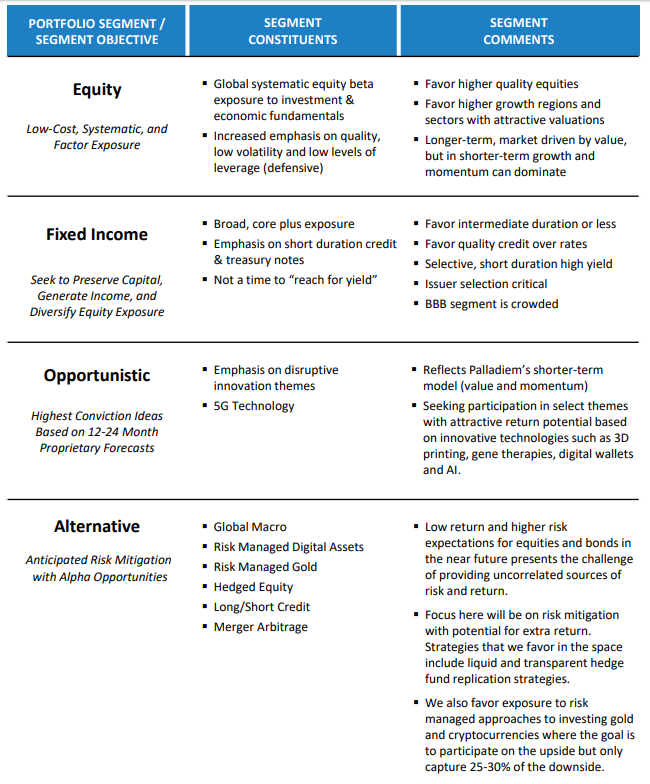
Current Investment Strategy and Themes
- COVID‐caused collapse in March leads to massive upswing in the 2nd quarter across the capital markets.
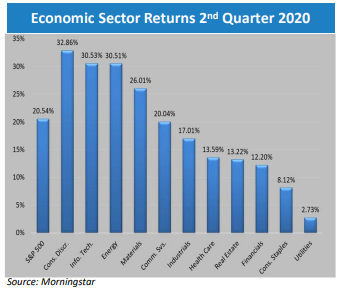
- Two tiered economic recovery reflected in two tiered equity returns
- Portfolios should be positioned for quality and innovation.
The Markets in Review: June 2020
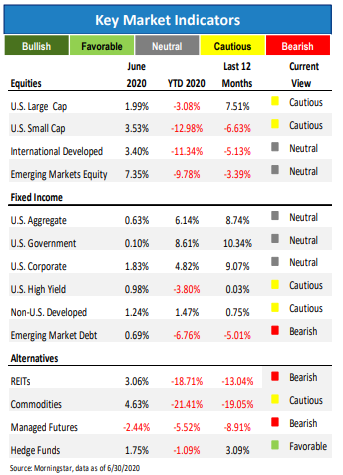
June capital market returns were positive across most asset classes and strategies. Backed by aggressive central bank policies to purchase corporate and high yield bonds and ETFs, the gradual ending of the most stringent COVID restrictions, and fiscal rescue packages, the equity markets posted one of the strongest quarters in decades.
The monthly and quarterly data for equity markets shows a broad recovery. The year‐to‐date and trailing one-year data show the broad divergences in equity style and size index returns. The leader in the month and quarter was the Nasdaq, which is not an asset class but a trading market. The Nasdaq performance reflects the technology dominance in market returns.
The S&P 500 briefly returned to a zero percent return for 2020 in early June, recovering almost all losses from the February and March downturn. The S&P 500 did end the quarter with a ‐3.08% YTD return. No other major domestic or international index can report that small a loss for 2020 at the end of June. The performance disparity between the S&P 500 and the other US and international indices widens even further over the last 12 month returns.
The technology sector and growth style returns are at record levels of style return disparity with most other equity market factors. For example, the Russell MidCap Growth index has returned +4.16% YTD, while the Russell MidCap Value index has declined ‐18.09% during that same period. The return of the S&P 500 is only giving a partial window into the state of the global equity capital markets.
The US bond market continued to post positive returns for the month and quarter. Federal Reserve Chair Powell stated during the month that he expected interests rates to remain near zero for years to come. The 10‐Year Treasury yield began the year at 1.92%. The yield now resides at 0.64%. Falling yields drove the highest bond returns at the long end of the curve.
With rates near zero levels and equity prices justified by 2021 earnings, risk control measures cannot be ignored or minimized in portfolios. Non‐correlating assets like gold and cryptocurrencies have a place in various asset allocation strategies. Economic uncertainty is best hedged with a quality oriented portfolio.


Valuation
Global asset valuations remain historically expensive despite the recent sell‐off in risk assets.
Add to this an unpredictable and ugly earnings forecast through the remainder of this year.
Our view is that markets will continue to be driven by the ebb and flow of investor sentiment
tied to the recovery from COVID‐19. Market uncertainty will remain high. Flight to safety is
most prudent now with an emphasis on de‐leveraging and free cash flow.

Earnings
With most of the global economy pushed into a severe recession, earnings for the next
several quarters should be negative across most industries. With the significant drop in sales
revenue combined with heavy fixed and variable costs, companies will have to focus more on
balance sheet repair as opposed to profit maximization.

Macroeconomic
Global economic growth and inflation have fallen and will move lower throughout the course
of the year or at least until more certainty is evident with respect to testing, tracing and
treating COVID‐19. We believe the economy is in severe recession already, and at risk for a
deflationary spiral.
Large scale labor dislocations and oncoming credit concerns suggest much additional fiscal
stimulus, not monetary, will be needed.

Liabilities
Liabilities have exploded on government and corporate balance sheets over the last cycle.
Household borrowing rates are not far behind. The shift now will be on balance sheet repair
and debt repayment and not on earnings growth and increased individual spending This will
place additional pressure on growth and governments to provide extra stimulus programs to
re‐start the global economy.

Technical/Sentiment
The biggest driver of security price swings since COVID‐19 has been investor psychology and
sentiment, not investment or macroeconomic fundamentals. The radical uncertainty with the
onset of the global virus pandemic has resulted in highly volatile equity and credit markets.
In our view, recent market rallies are more likely consistent with a bear market rally as
opposed to “coming off the lows” of an extended bull run. There is very little fundamental
nor economic support for any extended rally at this time.
Important Disclosures
The statements contained herein are based upon the opinions of Palladiem LLC (Palladiem) and the data available at the
time of publication and are subject to change at any time without notice. This communication does not constitute
investment advice and is for informational purposes only, is not intended to meet the objectives or suitability
requirements of any specific individual or account, and does not provide a guarantee that the investment objective of any
model will be met. An investor should assess his/her own investment needs based on his/her own financial circumstances
and investment objectives. Neither the information nor any opinions expressed herein should be construed as a
solicitation or a recommendation by Palladiem or its affiliates to buy or sell any securities or investments or hire any
specific manager.
Palladiem prepared this Update utilizing information from a variety of sources that it believes to be reliable that may
include, but not be limited to, custodians, mutual fund companies, investment managers, Morningstar, Bloomberg, other
third‐party service providers and in some cases as directed by the client or their representative. Palladiem takes
reasonable care to ensure the accuracy of such information but does not warrant that it is complete, accurate or adequate
and it should not be relied upon as such.
It is important to remember that there are risks inherent in any investment and that there is no assurance that any
investment, asset class, style or index will provide positive performance over time. Diversification and strategic asset
allocation do not guarantee a profit or protect against a loss in a declining markets. Past performance is not a guarantee of
future results. All investments are subject to risk, including the loss of principal. Portfolio positions referenced are subject
to change at any time, your portfolio may not reflect the information referenced.
Palladiem has sole discretion to change allocations to styles and vehicles at any time.
Index definitions:
“U.S. Large Cap” represented by the S&P 500 Index.
“U.S. Small Cap” represented by the Russell 2000 Index.
“International” represented by the MSCI Europe, Australasia, Far East (EAFE) Net Return Index.
“Emerging” represented by the MSCI Emerging Markets Net Return Index.
“U.S. Aggregate” represented by the Bloomberg Barclays U.S. Aggregate Bond Index.
“U.S. Government” represented by the Bloomberg Barclays U.S. Government Bond Index.
“U.S. Corporate” represented by the Bloomberg Barclays U.S. Credit Bond Index.
“U.S. High Yield” represented by the Bloomberg Barclays U.S. Corporate High Yield Index.
“Non‐U.S. Developed” represented by the S&P International Treasury ex U.S. Index.
“Emerging Market Debt” represented by the JP Morgan GBI‐EM Global Core Index
“REITs” represented by the FTSE North American Real Estate Investment Trust (REIT) Equity REITs Index.
“Commodities” represented by the Dow Jones Commodity Index .
“Managed Futures” represented by the Credit Suisse Managed Futures Index.
“Global Macro” represented by the Credit Suisse Global Macro Index
Palladiem, LLC is a Registered Investment Adviser.
For more information about Palladiem, as well as its products, fees and services, please refer to Palladiem’s website,
www.palladiem.com or call us at 888‐886‐4122; 610‐304‐6529


