A Guide to Responsible Indexing

The rise of “Direct Factor Indexing” has been democratizing force for investors.  By allowing diversification, tax-optimization and customization directly via SMA/UMA technology, investors now have an entirely new menu of options for creating efficient portfolios. While this is beneficial to investors, it comes with an important caveat: “Buyer Beware”…

As technology and data have become cheaper and easier to access, the portfolio building process has been democratized.  The problem this presents, however, is that indexing was previously a domain exclusive to experienced professionals (who had access to the proper tools and insights) and now has become available to anyone with a good idea for a backtest.

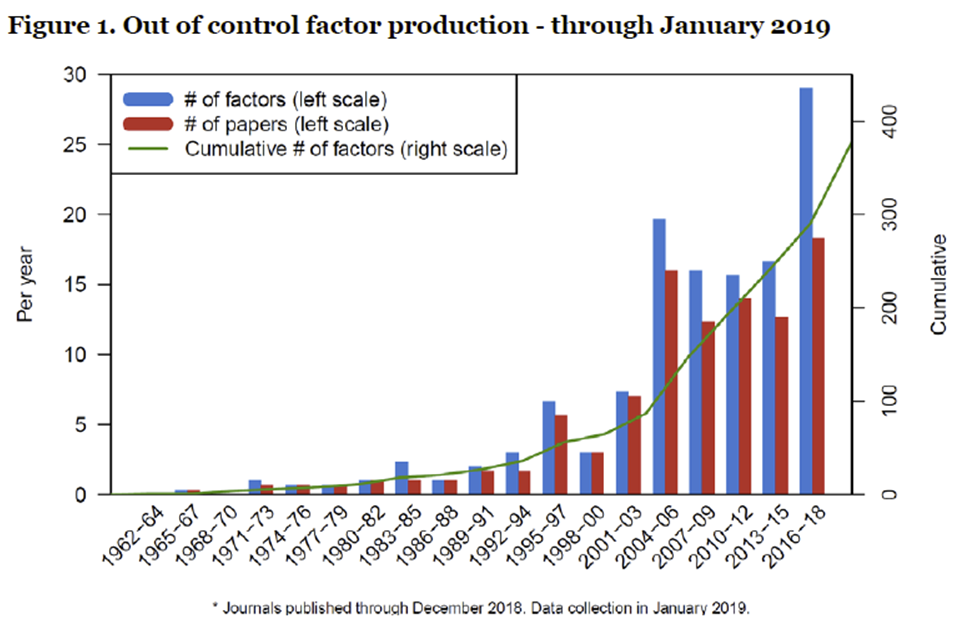
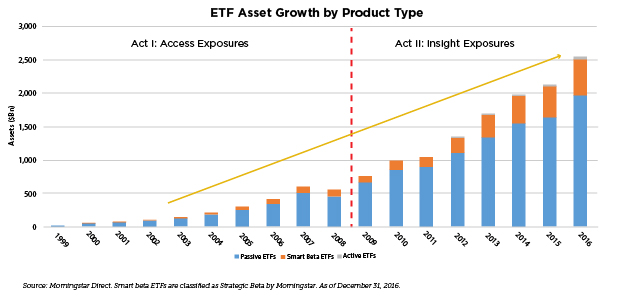
This has led to an explosion of “factors” indices that has fueled a rapid increase in so-called “Smart Beta” ETFs:

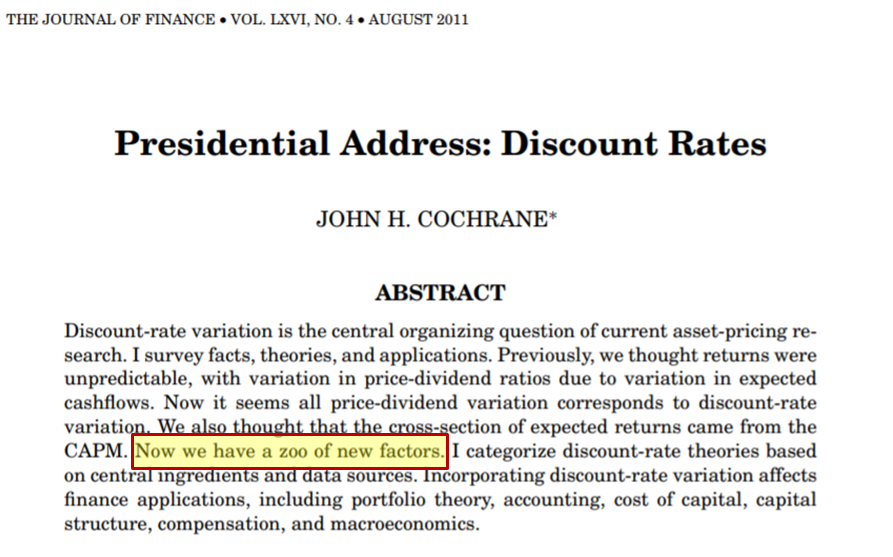
The Factor Zoo

This has led to the “zoo” of factors, and subsequent questions regarding the robustness of each new factor (and index).  With more access to data and computing power, academics wasted no time in finding “new” factors to tout.

This has also led prudent investors to ask “are all these factors robust?”  Like the saying goes, if an infinite amount of monkeys were left to bang away on typewriters, what’s the likelihood that one of them would perfectly type out Shakespeare’s Hamlet?

The answer: 100%

Don't Bet on Butter

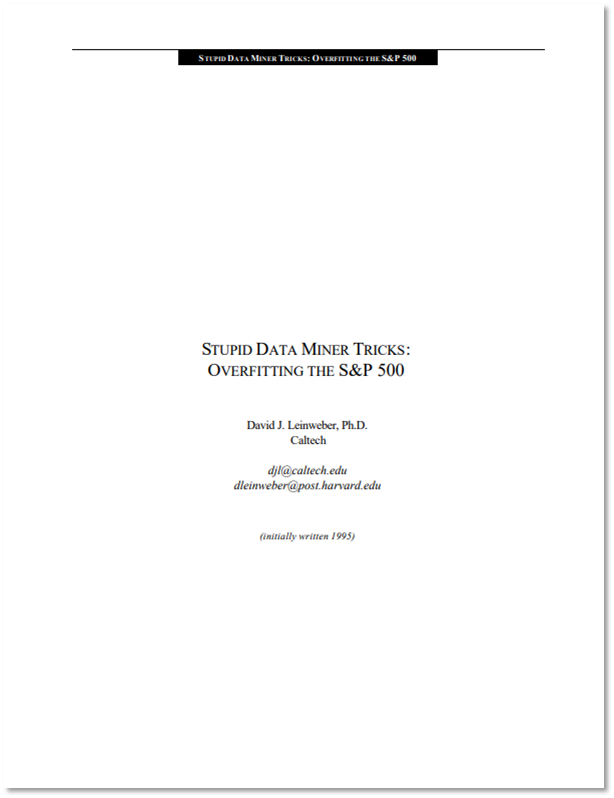
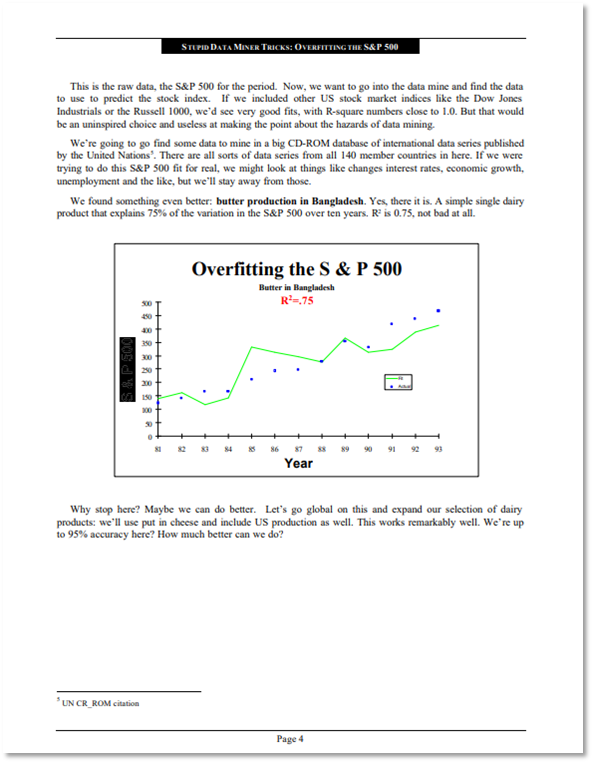
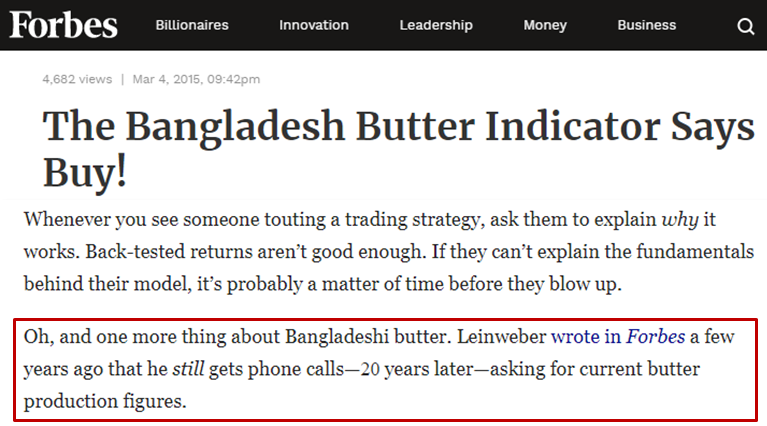
The problem of spurious correlations in the financial markets is not new.  In fact, in what has now become a famous research paper, a mathematician from Caltech (David Leinweber) in 1995, illustrated how easy it can be to show a strong correlation between S&P 500 returns and butter production in Bangladesh:

Dr. Leinweber’s example highlights one the key difficulties in statistical analysis: 

correlation does not necessarily equal causation.

Nevertheless, humans have proven adept at finding patterns where none exist. 

In fact, to this day Dr. Leinweber still gets calls asking about butter production in Bangladesh.  Investors are always looking for a new “edge.”

Principles for Responsible Indexing

We believe the largest issue in designing robust indices is not necessarily bad actors looking to engineer deceptive backtests but rather the biases that plague all investors. Some bad practices are obvious and avoidable. The “Bangladesh Butter Index”, for example, is clearly an example of spurious correlation.  In practice, however, creating an index that is both sophisticated and robust is not as easy. The subtle addition of ‘too much complexity’ can be difficult to identify, however, because layers of sophistication (which might prove logical on an individual basis) can slowly migrate towards a data-mined result when combined in the aggregate.

To mitigate this, we outline some helpful frameworks for approaching index creation.

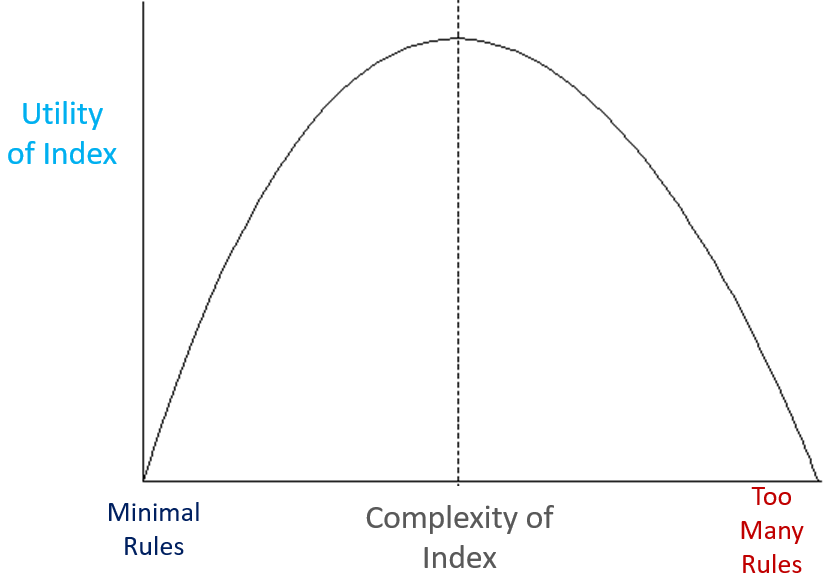
The first one is borrowed from classical economics.  Any student of economics will recognize this as the “Laffer” curve which traditionally shows government revenue on the Y-axis and tax rates on the X-axis.  At 0% and 100% tax rates, the government collects no revenue (because despite what some would have you believe, nobody will work for free).  Outcomes are maximized when moderation is employed…not at the extremes.

This is a useful construct because the same functional form applies to the level of sophistication in all indices.  Too little complexity and the index won’t deliver enough utility to the investor (imagine if your ONLY investing option was a price-weighted index of 30 industrial companies, for example).  Similarly, too much complexity, and you run the risk of spurious relationships that hold little (if any statistical power out-of-sample):

While it’s impossible to prescribe a “one-size-fits-all” set of rules for all index construction we do believe that there are 4 guiding principles that are universal.  Specifically, 2 questions that should be asked at the outset and 2 questions that should be answered with the data:


The last two rules are important

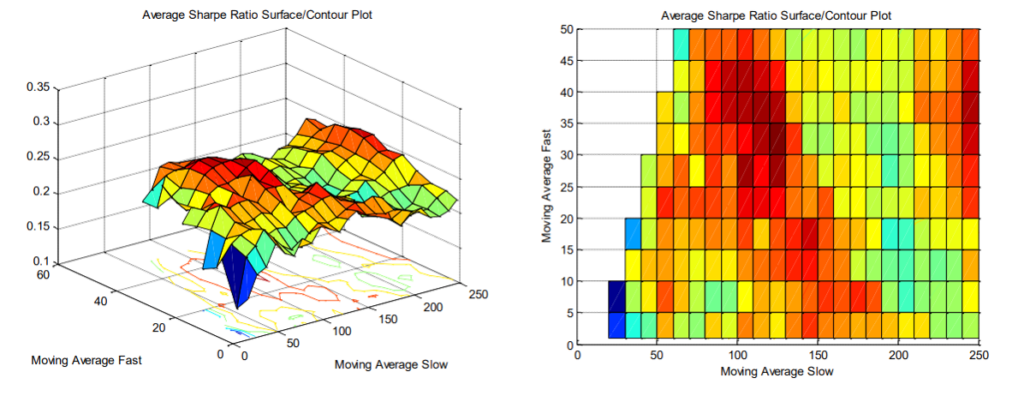
To illustrate this, we present an internal analysis for a trend-following index that we audited. The specific index applied a moving-average crossover strategy to the commodities complex.  Specifically, when the 5 day moving average for a particular commodity is above the 200 day moving average, the index would go long, otherwise it would be flat. These rules seem reasonable and are backed by third party research but we still need to go through the exercise of creating an “index” for every (reasonable) combination of moving averages to observe the distribution of outcomes.  So the “fast” moving average in this case is 5 and the “slow” moving average is 200. What happens if we look at the 5 day moving average vs. the 201 day moving average?  

By actually going through this exercise and creating an “index” for every combination of “fast” moving average between 1 and 50 days against a “slow” moving average between 20 and 250 days.  The result is dozens of indices, each with 20 years of backtested data to observe, that gives a much more comprehensive picture of the distribution of outcomes.  The graphs below show the sharpe ratio (on the z-axis) for each of these indices (which is represented by a different combination of X and Y axis).

This parameter topology (as we call it) is a crucial part of the Indexing as a Service framework.

Without necessarily delving into the statistics, one can simply observe the marginal change in sharpe ratio (in this example) for a given change in parameters.  This outcome may or may not be acceptable depending on the investors preferences.  The key is in understanding what this relationship looked like historically in understanding what the reliability is going forward.

Check out some clips from our 2019 Indexing as a Service conference where we discuss the idea of “Responsible Indexing”…

Information is presented for illustrative purposes only.  IDX Insights makes no guarantees regarding accuracy or completeness. Unless otherwise noted, performance information is hypothetical and GROSS of all associated fees and sales and trading expenses that an investor might incur. You cannot invest directly in an index. Hypothetical or model performance results have certain limitations including, but not limited to: hypothetical results do not take into account actual trading and market factors (such as liquidity disruptions, etc.). Simulated performance assumes frictionless transaction costs and no lag between signal generation and implementation. Simulated performance is designed with the benefit of hindsight and there can be no assurance that the strategy presented would have been able to achieve the results shown. There are frequently large differences between hypothetical performance results and actual results from any investment strategy. While data was obtained from sources believed to be reliable, IDX Insights, LLC (“IDX”) and its affiliates provide no assurances as to its accuracy or completeness.

Disclaimer

IDXINSIGHTS

The content provided on this website is informational, subject to change and is not investment advice or any offer or solicitation for the purchase or sale of investments.  Any use of this content is subject to and evidence of the user’s acceptance of all important legal disclosures, disclaimers, terms of use and provisions found at www.idxinsights.com/legal, including the user’s complete release of liability for any use of the content, which may contain inaccuracies. 

Unless otherwise noted, performance information is hypothetical and GROSS of all associated fees and sales and trading expenses that an investor might incur.  You cannot invest directly in an index.  Hypothetical or model performance results have certain limitations including, but not limited to: hypothetical results do not take into account actual trading and market factors (such as liquidity disruptions, etc.).  Simulated performance assumes frictionless transaction costs and no lag between signal generation and implementation. Simulated performance is designed with the benefit of hindsight and there can be no assurance that the strategy presented would have been able to achieve the results shown.  There are frequently large differences between hypothetical performance results and actual results from any investment strategy.  While data was obtained from sources believed to be reliable, IDX Insights, LLC (“IDX”) and its affiliates provide no assurances as to its accuracy or completeness.
By clicking ACCEPT you acknowledge that you are a financial professional