The primary source of risk within the fixed income universe is:
(i) Duration Risk: As rates increase, the stream of promised payments to the bondholder are worth less.
(ii) Credit Risk: The risk that the “promised” payments stop being paid.
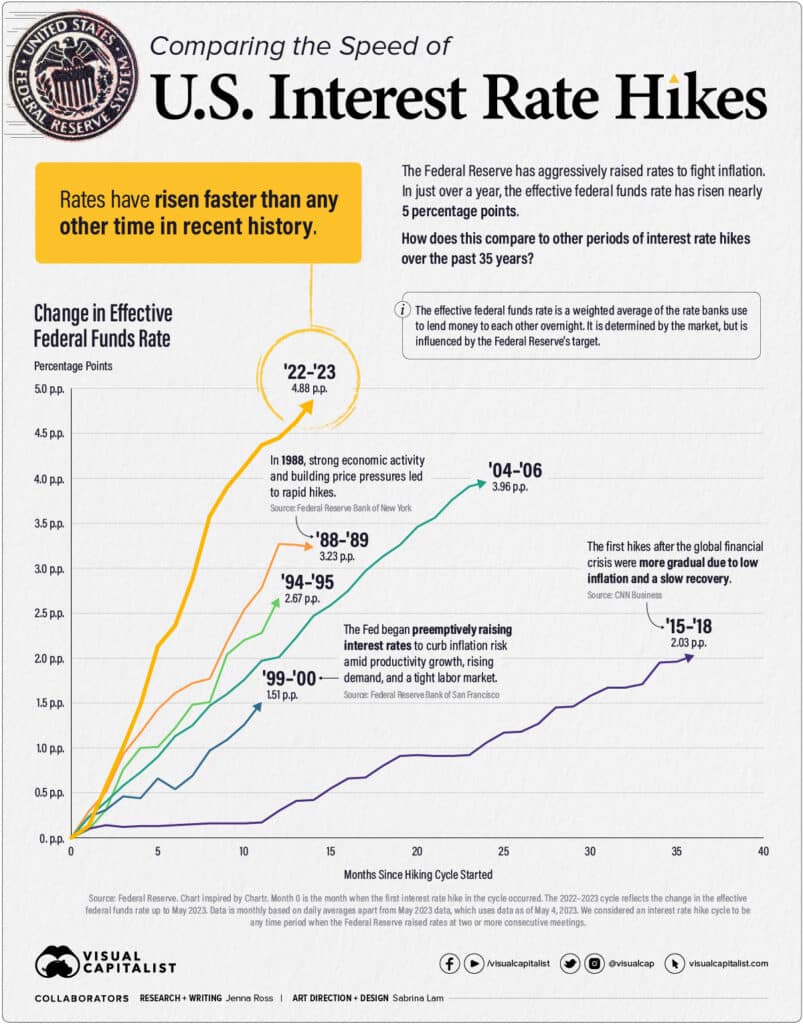
As the Fed embarked on its most aggressive rate hike in history, investors were forced to contend with duration risk within their portfolios in a way that most have likely never experienced in their careers.
As the market now discounts the likelihood of a “soft landing” in the context of an inverted yield curve and a potential recession (and what that might mean for equities)…bond investors are now facing the prospect of material credit risk within their portfolios.
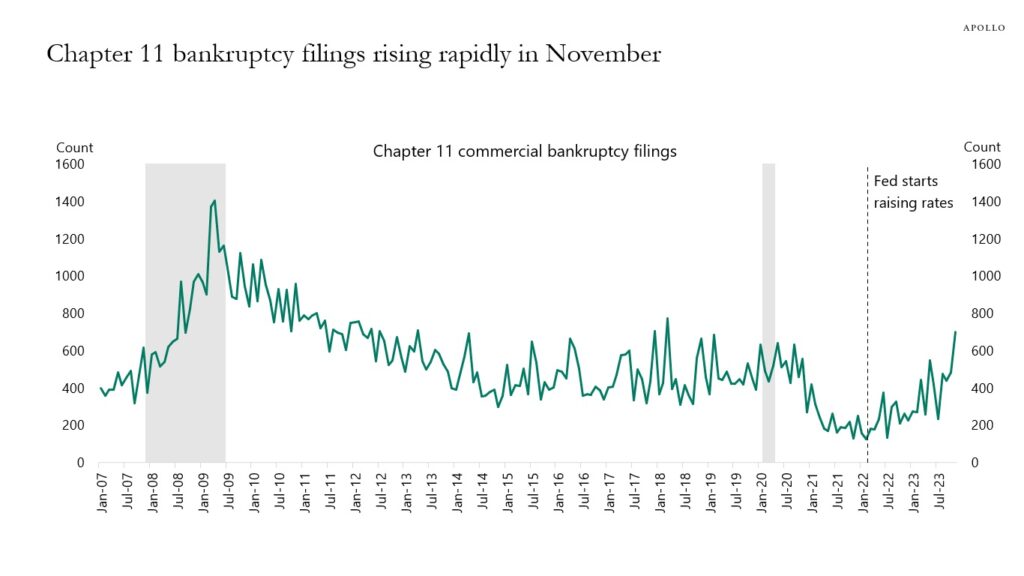
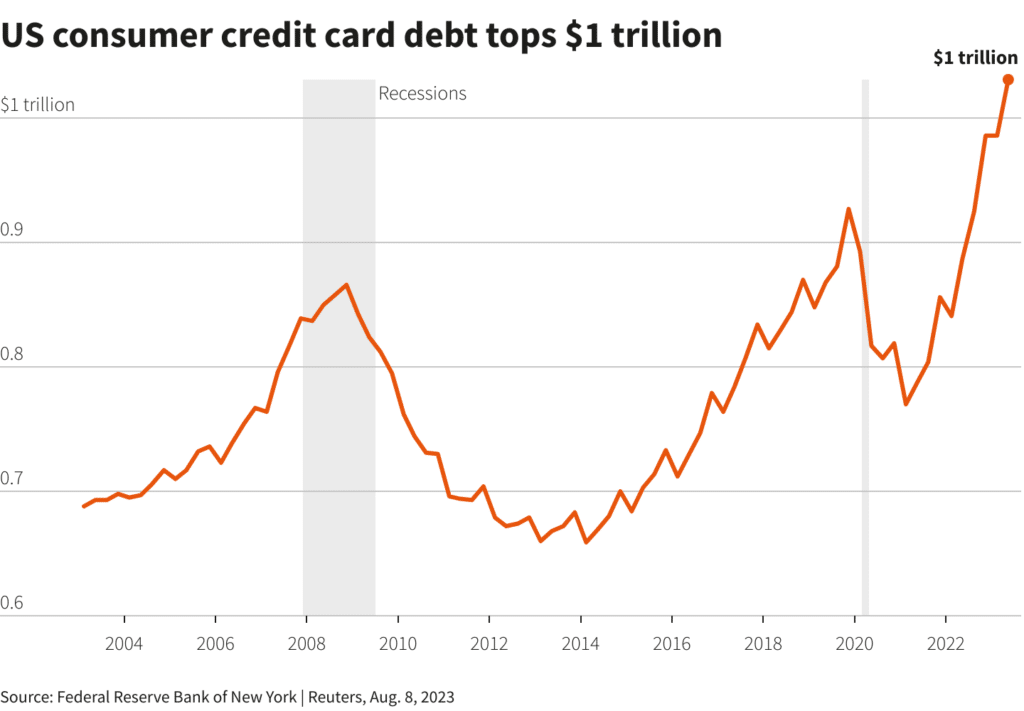
Post-pandemic Commercial Real Estate was the canary in this particular coal mine, but the data is now painting a very real picture of a broader credit crunch amid elevated rates, a slowing economy and a stretched consumer.
As investors, we recognize that with risk comes reward (or at least the opportunity for reward). So how best to approach this opportunity?
A Dynamic Approach to Fixed Income
in 2022, IDX launched a strategy that actively rotates among a universe of fixed income ETFs in a way that seeks to mitigate both the Duration and Credit risk that lurks within the traditional (static) bond allocations.
As with everything we do, the strategy is rules-based, transparent and designed to take advantage of the superior liquidity characteristics that the ETF wrapper provides for fixed income instruments.
This strategy was launched, in response to the growing duration risk within existing bond allocations that most investors were entirely unaware of.

A Look at the Data…
The numbers presented include hypothetical model data with inherent assumptions and were generated with the benefit of hindsight. Contact IDX for more information.
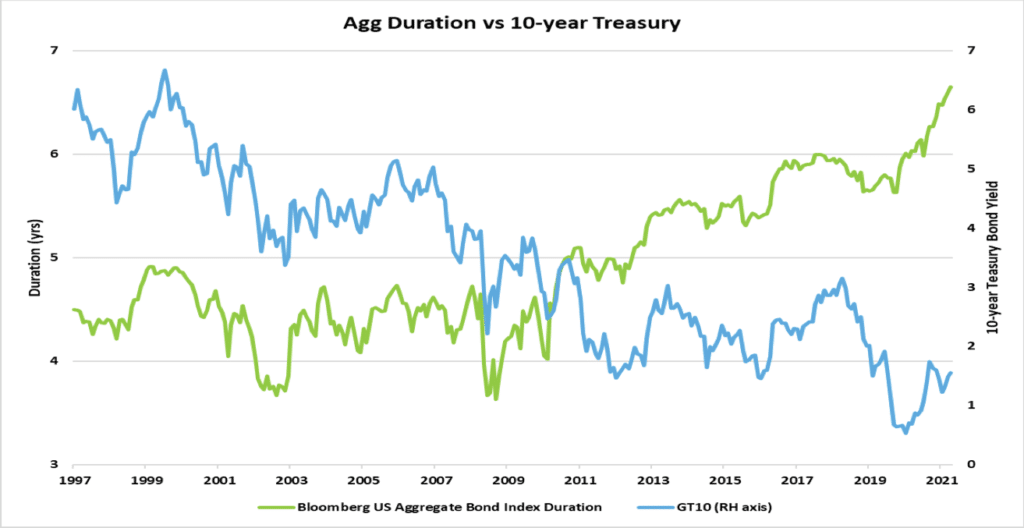
Since 2015 the Barclays Aggregate Bond ETF (AGG) has averaged a duration of roughly 6 while the IDX Dynamic Fixed Income model (DFI) has averaged about 4.
DFI max/min duration during the period was 11.2 and -4.15 respectively. At a duration of 11, a portfolio would be expected to lose about 11% given a 1% rise in rates…conversely with a -4 duration the portfolio would be expected to gain 4% in value given a 1% rise in rates – all else being equal.
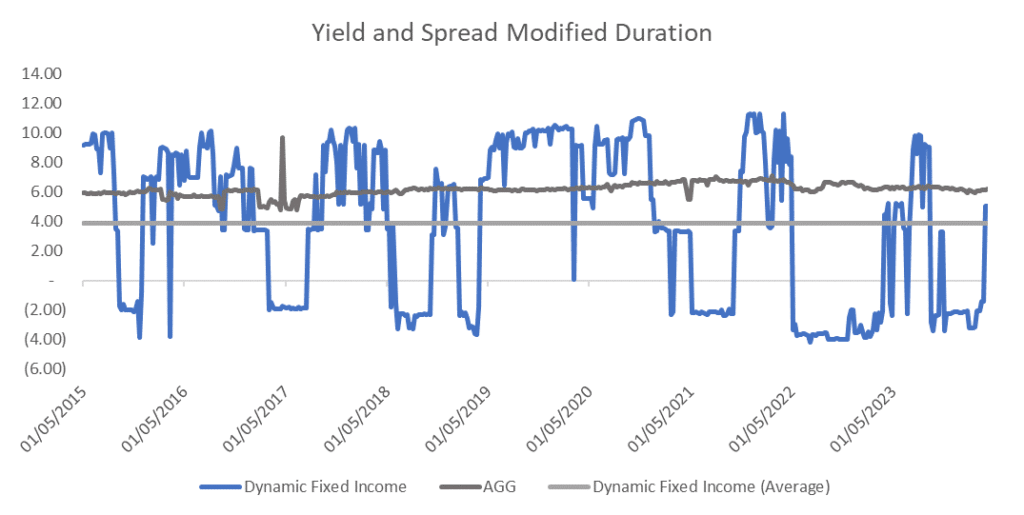
The main observation on the graph above is just how tactical the Dynamic Fixed Income model is – on average it’s taking less interest rate risk than the benchmark while maintaining several significant periods of opportunistic risk-taking.
For instance:
- Average duration during the 2018 hiking cycle was less than 1
- Average duration during the broad “risk-on” fed pause of 2019 was more than 9
- During the “Live period” during 2022 and 2023, the model was able to monetize the increase in policy rates with an opportunistic short bond position.
Important to point out that even though on average the model is taking less interest rate risk than the AGG, it is always taking risk.
Low/negative duration risk should not be taken blindly as “risk-off” (even though often accompanied by low-risk positions like 0–2-year treasuries). Even at its average duration of 4, this portfolio could be comprised of bank loan ETFs, shorter maturity high yield ETFs, and fallen angel bond ETFs – all which offer equity-like risk/return profiles.
A similar look at exposure to credit risk over time, again shows a very tactical and opportunistic approach to allocating to credit-sensitive bond ETFs (e.g. High-yield, bank loan, fallen angel, etc.)
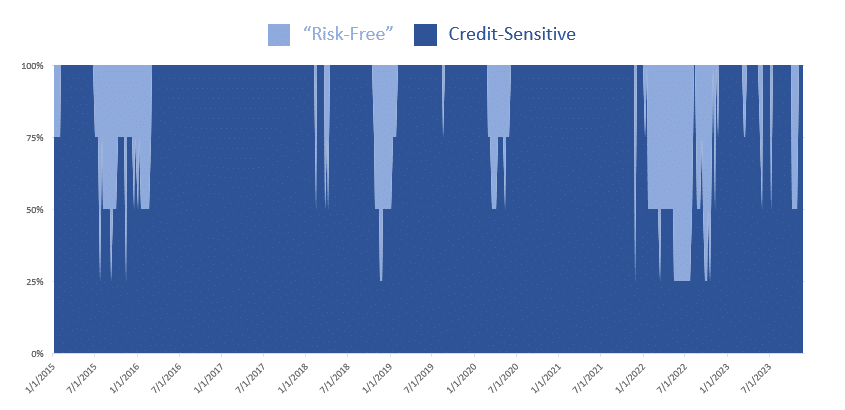
It’s also worth noting that it is only because of the proliferation of fixed income ETFs in recent years that investors even have the opportunity to implement such a tactical approach within this sector. The ability to rotate into and out of high-yield bonds is something of a superweapon in the toolkit of investors these days…and one in which we think more should utilize.
The Takeaway
For this reason, we emphasize that a tactical bond portfolio isn’t designed to be a replacement for a traditional bond allocation but rather a complement to a core bond portfolio. Specifically one which seeks to take intelligent risks across the core fixed income drivers.
Also, the strategy isn’t just tactically modulating the duration risk but also the credit risk. Like the chart shown above, the ability to dynamically and opportunistically participate in both Duration and Credit risk some of the time while not being forced to participate ALL of the time is, we believe, a crucial tool for bond investors going forward.
Final thoughts…as investors head into 2024, the fixed income part of the portfolio is no longer an afterthought for most. Now, with the prospect of a more normalized rate environment coupled with the potential for credit volatility, the fixed income spectrum offers both more risk and reward. The key (we believe) is to be more nimble…
Important Performance Disclosures relating to Index information & performance
Unless otherwise noted, performance information is hypothetical and GROSS of all associated fees and sales and trading expenses that an investor may pay to purchase the securities underlying this index or investment vehicles intended to track the performance of this index. You cannot invest directly in this index. Hypothetical or model performance results have certain limitations including, but not limited to: hypothetical results do not take into account actual trading and market factors (such as liquidity disruptions, etc.). Simulated performance assumes frictionless transaction costs and no lag between signal generation and implementation. Simulated performance is designed with the benefit of hindsight and there can be no assurance that the strategy presented would have been able to achieve the results shown. There are frequently large differences between hypothetical performance results and actual results from any investment strategy. While data was obtained from sources believed to be reliable, IDX Insights, LLC (“IDX”) and its affiliates provide no assurances as to its accuracy or completeness.
This document has been provided to you solely for informational purposes and does not constitute an offer or solicitation of an offer, or any advice or recommendation regarding the purchase of, any securities or other financial instruments and may not be construed as such. The factual information set forth herein has been obtained or derived from sources believed by IDX to be reliable but it is not guaranteed as to its accuracy and it is not to be regarded as a representation or warranty, express or implied, as to the information’s accuracy or completeness.
IDX does not recommend, endorse, approve or otherwise express any opinion regarding any issuer, securities, financial products or instruments or trading strategies. Nothing contained herein constitutes investment, legal, tax or other advice nor is anything herein to be relied on in making an investment or other decision. Historic market trends are not reliable indicators of actual future market behavior or future performance of any particular investment which may differ materially, and should not be relied upon as such.
