The Case for Gold
The strategic case for gold has commonly revolved around its long history as a store of value. Since it was first discovered, humans have been drawn to the yellow metal since despite its inability to pay any dividend or provide ownership in any productive output.
From an investment perspective, gold has demonstrated an ability to provide a long-term source of uncorrelated returns to stocks and bonds while also serving a “flight to safety” hedge during periods of geopolitical or fiat instability.
While there are plenty of speculators looking to gold as a source of potential out-sized return, most of the investing public looks to gold at the intersection of those two objectives: uncorrelated return and risk management. Therein lies its more recent appeal among investors, particularly as a trusted hedge against the unprecedented level of money supply expansion we have witnessed in recent months.
Even the most significant traditional criticism of gold (that it pays no dividend and costs money to store) has become much less of an issue in a world of negative real interest rates and historically low/negative nominal interest rates.
Shifting Global Demand
Historically, most gold demand (roughly 60%) has been used in jewelry (and to a lesser degree, technology). However, more recently (about 10 years ago), central banks have collectively emerged as a net buyer of gold after reversing a long-term trend in the wake of the financial crisis :
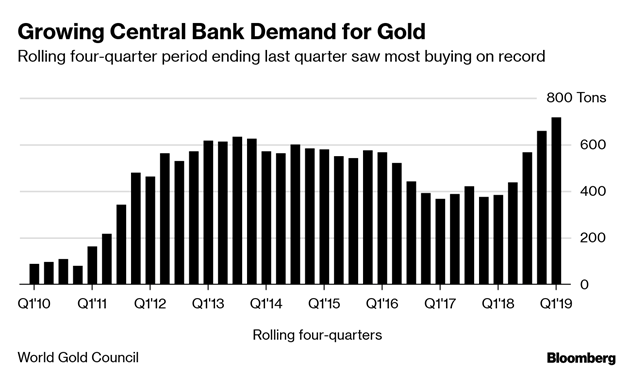
While this provides an already bullish backdrop for gold, the very aggressive global monetary policy measures of Q1 2020 (coupled with negative real yields) only served to amplify this view of gold as a portfolio hedge.
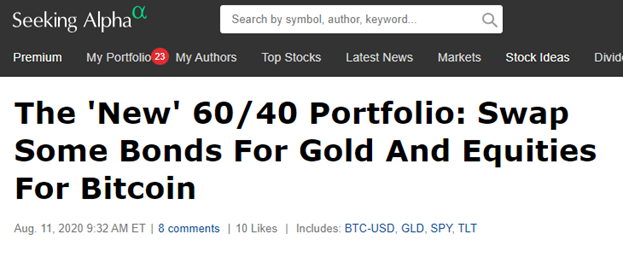
As expected, many investors began quickly exploring the viability of adding a gold allocation to the traditional “60/40” portfolio:
“The Fed Can’t Print More Gold”
With an unprecedented increase in both federal debt and the money supply, investors that do not hold gold are now reconsidering. Bank of America’s Michael Widmer sums up the mood succinctly: “The Fed can’t print more gold.” As the owner of the global reserve currency, the United States likely has more fiscal space than we can imagine. Investors would be remiss not to notice that gold has long trended with the US money supply (albeit with significant deviations around the trend).
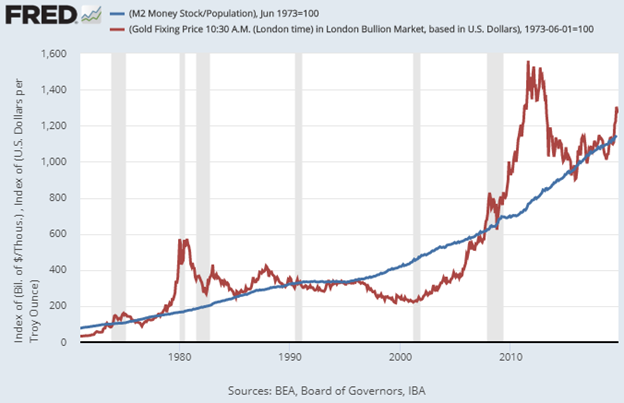
While we’re quick to caution that any comparisons of non-stationary time-series (as in the case of M2 and Gold Prices) can be troublesome from a statistical perspective, it is nevertheless interesting to observe the trends in these two series over time, regardless of the causality (inferred or otherwise).
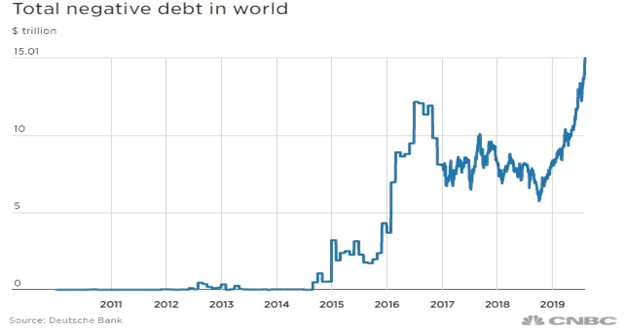
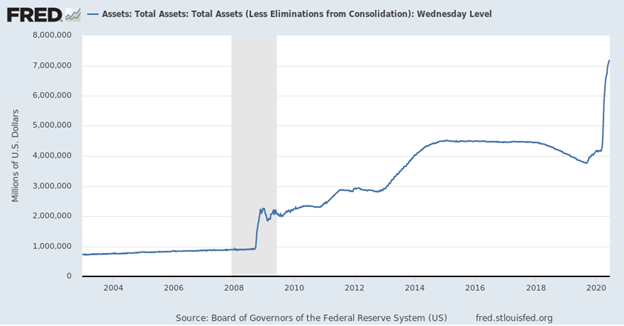
While there is compelling (and robust) evidence to support placing gold within a traditional portfolio, we are quick to remind investors that gold is prone to periods of high volatility and large drawdowns. Looking at point-in-time portfolio statistics over a long period can quickly gloss over the fact that, while gold has kept up with equity returns over time, it has been a wild ride. With the benefit of hindsight, a sustained 50% drawdown may not look so bad. Still, when investors are experiencing it, the likelihood of sticking to the original target gold allocation becomes much lower.
The Problem with Gold
Despite the constellation of factors favoring gold, if the past is prologue, the path will have its bumps. Gold has always been, and remains, a volatile asset class. More importantly, gold has been prone to extended drawdowns:
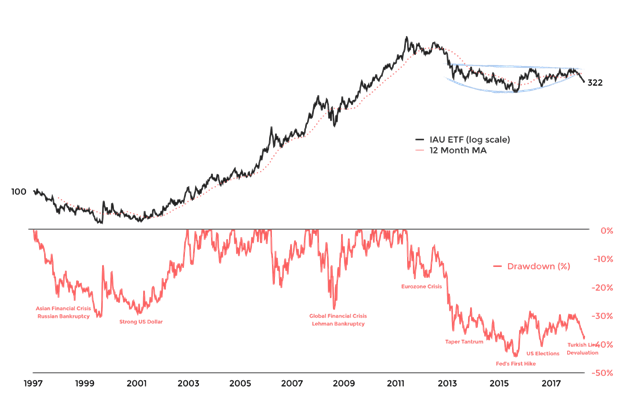
Over time, gold’s utility within a diversified portfolio is clear, but it can be less noticeable over shorter periods. Given the unique uncertainties facing investors, many investors new to gold have been quick to add the yellow metal into portfolios as a “catch-all” hedge.
While some would be quick to point out that investors should have a long-term horizon, which is (generally) right, it does not invalidate the negative impact of volatility on a portfolio. For those with a multi-generational view, the periods of high volatility may not matter as much. However, for most investors, particularly those approaching retirement, gold’s volatility may outweigh its benefits.
The Risk Premium of Gold
Traditional risk premia are defined as the excess return of an asset (over the risk-free rate) that represents the compensation (or “premium”) paid to investors in exchange for underwriting the additional volatility associated with that asset (the “risk”). Generally, investors evaluate risk premiums within the context of a discounted stream of cashflows. The size and probability of those cash flows (coupon payments in the case of bonds and earnings in stocks) determine the appropriate risk premium over time.
While gold does not provide a stream of future cash flows for investors, it does have genuine utility as a store of value. And this utility is a function of interest rates, inflation expectations, fiat stability, and future uncertainty. To the extent investors allocate to gold based on a future state that reflects these factors, a risk premium is present. And just as “irrational exuberance” (or pessimistic selling) can cause deviations of equity returns from their long-term expected risk premia, gold is no different.[1]
Supply & Demand
Over time, macroeconomic factors, such as inflation expectations, interest rates, and money supply, are critical drivers in determining the equilibrium price of gold. But in the short-term, supply and demand dynamics drive gold prices.
The supply of gold on earth is relatively fixed (although technically, meteorites can bring incremental gold onto our planet). And only comparatively small amounts are made available each year from gold mining & scrap operations:
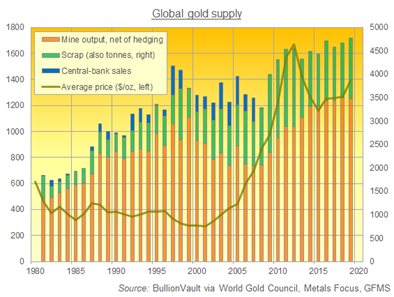
So, the world’s gold supply could fill up an Olympic sized pool and will not get much bigger anytime soon:
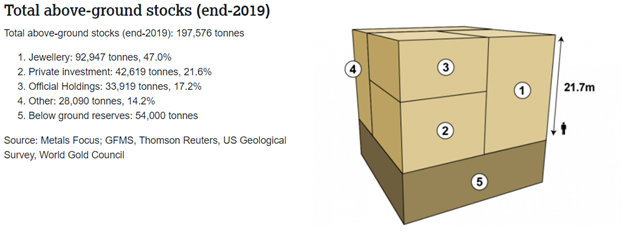
As such, Demand is the more important driver of gold prices and the two largest sources of demand for gold are (i) Jewelry and (ii) Investment purposes:
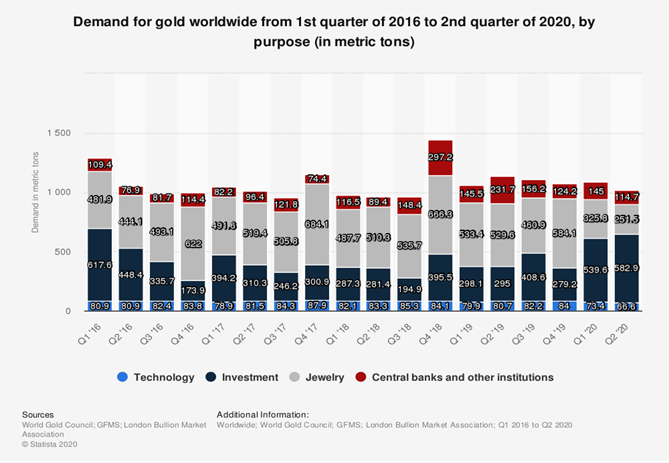
As can be seen, gold buying for investment purposes has become the largest source of marginal demand in recent years, driven in no small part by the introduction of Gold ETFs, which made owning gold an accessible reality for the entire investing public.
The Importance of Momentum:
A Disciplined Risk-Managed Approach
More than a century of evidence supports the utility of momentum across different geographies, asset classes, and time-frames. Several behavioral theories have been penned to explain this[1]phenomenon but suffice it to say, they all involve some initial under-reaction and delayed over-reaction to new information. The appeal of these explanations is they should be structurally persistent. Humans are likely always going to over and under react to information. Ben Graham famously posited, “in the short-run, a market is a voting machine, in the long-run, a weighing machine”. Momentum has proven to be an effective way to evaluate the short-term.
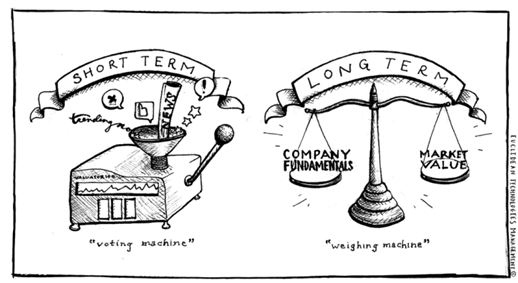
Momentum is a compelling risk factor related to evaluating the risk premium of gold in the shorter term and, more specifically,whenthe premium is worth the associated risk. The risk premia of different asset classes are time-varying, and gold is no exception. For example, the risk premium of equities, all else equal, is different when the CAPE ratio is at 30 than when it is at 7. As a result, it is instructive to use gold’s price momentum to shed some light the relative attractiveness of its risk premium.
Not all About Expected Return
One of the primary appeals of a time-series momentum approach is its ability to manufacture a convex payoff profile.
“Cut short your losses, and let your profits run on.”
You can’t control the returns of an investment but you can control your risk. More precisely, you can control how and when you put capital at risk. Momentum provides for a systematic way to “cut short your losses and let your profits run on.” Given higher confidence around taking a risk allows for broader utility within a more comprehensive portfolio.
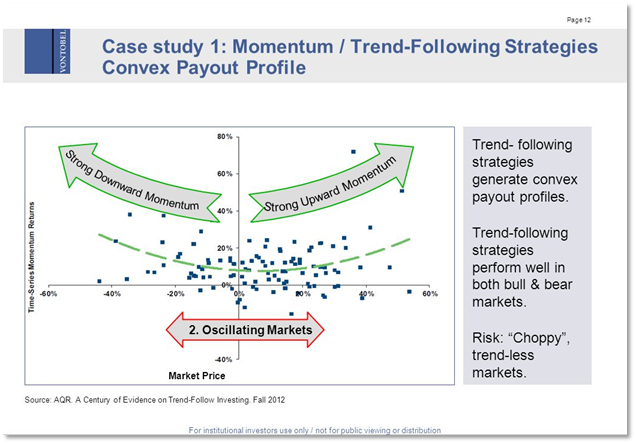
The appeal of using momentum as a means of risk-control is the more critical (and perhaps the less appreciated) feature of such an approach as it relates to a higher volatility asset class like gold.
Identifying Compensated Risk: Conviction Weighted Momentum
Because risk-control is the feature we focus on, propose a framework for extending traditional momentum to include another dimension that seeks to further refine the “risk environment” in which we deploy capital. There is both a theoretical and practical purpose. Theoretically, if the threshold for deploying risk capital increases (within reason) within a volatile asset class, one should further increase the asymmetry of the payoff structure. More practically, as gold has seen a renewed interest among a broader audience of investors (in light of recent Fed actions), the natural risk profile of a static long-only position to gold is likely going to be beyond the prudent level for many investors. Rather than have exposure to gold 100% of the time, investors can systematically regulate their exposure in a way designed to mitigate risk. The objective being to gain exposure to the asset class without underwriting all the associated risks.
We propose a framework for evaluating prices in such a way that conveys useful information about the level of conviction underlying the momentum. Precisely, we assess the rate of change of prices over time (e.g., time-series momentum), but then we also consider if that momentum is increasing or decreasing (i.e., the rate of change of momentum). Considering the interaction effect between momentum and the rate of change of momentum (or “acceleration”) gives us a way to incorporate the first and second derivative of prices in describing various states of the world.
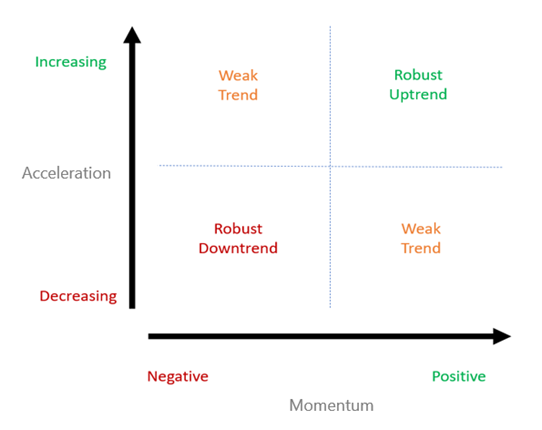
We can simplify these four outcomes into three states of interest.
The first is simply a long-only allocation, in which the model is allocated 100% of the time and makes no distinction between different states of the world according to the acceleration or momentum signal:
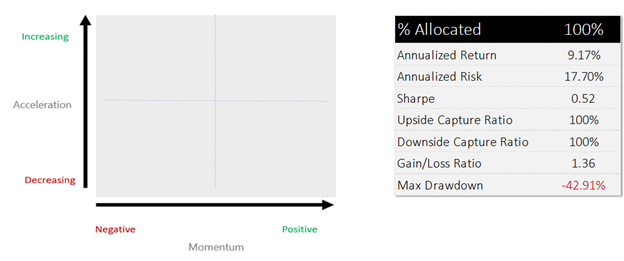
[The summary statistics shown are from 2005 through August of 2020 and assume no slippage or transaction costs as applied to the SPDR Gold Trust ETF (GLD).]
A second (and more interesting) state of the world is when gold prices demonstrate positive momentum.[1]In this state, the model allocates to gold roughly 56% of the time. Both the annualized return and risk of this model are lower than the long-only scenario, but the maximum drawdown is significantly lower in the momentum model (“cutting losses short”). This opportunity set would appeal to investors who prioritize risk-mitigation over return-seeking:

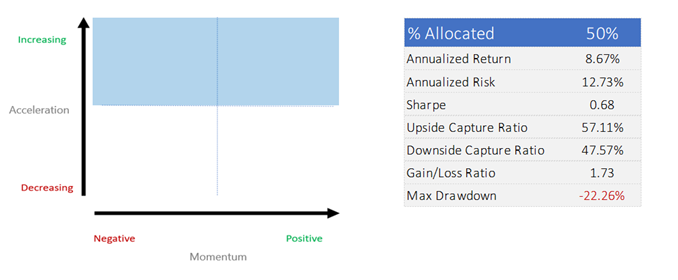
Similarly, if we consider the state of the world in which momentum is accelerating, we see another exciting result. It’s important to note that this state of the world includes scenarios where momentum is negative but getting better.
During this period, momentum is accelerating (i.e., improving) exactly half of the time. This variation reduces the drawdown and the annualized volatility without sacrificing as much annualized return as the pure momentum signal:
Finally, by intersecting the two conditions above, we arrive at the world defined by the “interaction effect,”[1]which occurs 32% of the time. This state of the world describes a very capital-efficient exposure to gold only during those periods in which the premium associated with the momentum effect is the most robust (at least by this approach):
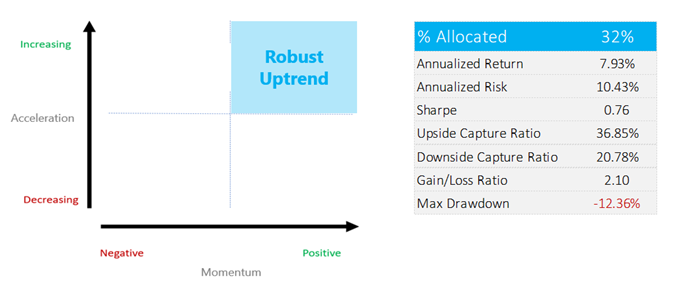
The rationale behind this is that when momentum is positive, the market is responding to marginal demand. However, by focusing on the smaller subset of time when buying pressure is increasing, we infer a degree of conviction behind the trend. Again, the objective is not one of incremental “return-seeking” but rather gradual risk-control.
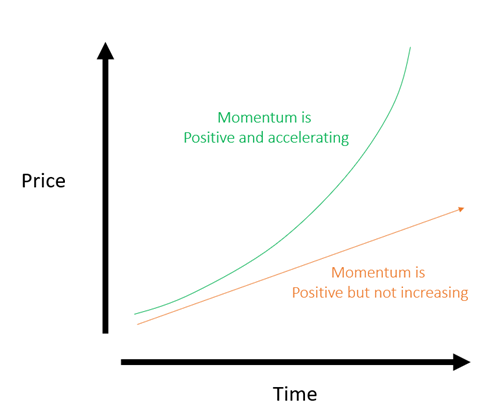
A natural reaction to the example above is to question, “as long as momentum is positive, does one care if it’s increasing?” After all, if you can compound at a steady fixed return each year, why miss out on that? The simple answer is the investor’s objective and trade-off preferences between capturing the upside and avoiding the downside.
By requiring that momentum be both positive and increasing, the investor is effectively requiring a higher bar for entry in establishing a “risk-on” position and a lower bar for exiting into a “risk-off” position (a judicious use of risk capital).
While the outlined approach has the utility to provide a risk-managed exposure alternative to gold, it also serves a useful price discovery mechanism. By stripping out only those returns subject to sufficiently robust and increasing demand pressures, we can observe a conviction-weighted risk premium of gold, which is otherwise embedded (and thus hidden) within the total return series of gold.
The Gold Efficient Frontier
By isolating only that part of the gold risk premium, which has the highest conviction, we can now have two options available:
(i) Long-only
(ii) Risk-managed
By doing this, more precisely, we now open an efficient frontier of the gold risk premium available to investors. The decision to invest in gold no longer must be relegated to choosing a single point on a risk/return plane. Over the period discussed above, a marginal decrease in expected return could have translated into a disproportionate reduction in annualized risk:
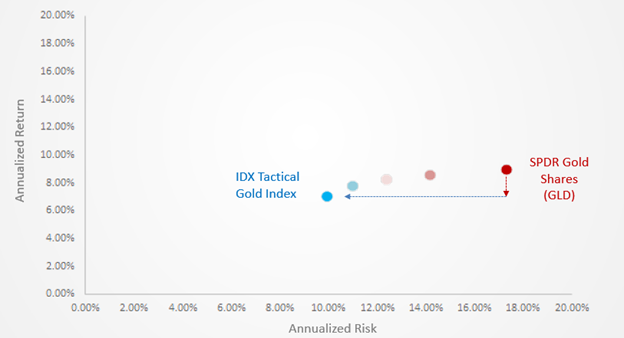
In this way, the presence of a risk-managed option for gold exposure opens up an appealing efficient frontier. While this may make sense as a complete replacement for a long-only gold position for some (risk averse) investors, it likely makes sense as a replacement for some portion of a long-only gold position for most investors.
To experiment with this yourself, use the slider below to observe the incremental benefit of introducing the IDX Tactical Gold Index into a long-only gold allocation. As can be seen, even a small allocation to a risk-managed approach can yield a considerable reduction in volatility without much sacrifice in return:
Data from 2005 through Q3 2020
How Risk Managed Gold Fits Into a Diversified Investment Portfolio
A 60% equity and 40% bond portfolio has been reasonably rewarding for investors over the last 40 years. More recently, investors have found that a 60/40 equity bond portfolio was, in reality, closer to a 70/30 portfolio in terms of equity risk exposure and equity-like volatility. The industry’s answer to this was to construct portfolios with risk parity in mind. Investors could more effectively manage the balance of equity and bond risk through increased allocations to bonds, while leveraging or borrowing against the bond portion of the portfolio to maintain a return profile similar to a traditional long-only 60/40 stock-bond portfolio.
We expect longer-term equity and bond returns to be significantly less than the long term historical averages…and with higher volatility. Record high stock market valuations, low expected growth rates, and negative real yields are the key drivers behind this forecast. The Federal Reserve has already stated that it intends to keep interest rates zero bound until the end of 2023 or until inflation moves to their 2% target, and the unemployment rate drops to 4%.
Risk managed gold has the risk and return profile similar to shorter duration high-quality bonds under normal circumstances. We are not living under normal circumstances, and the risk of parking assets in cash or cash equivalents is similar to paying someone to safe-keep your assets with no return. A good surrogate for short term fixed assets is risk managed gold. Risk managed gold is ultimately an uncertainty hedge, and the one thing we are bullish on now is uncertainty.
Disclosures: This document has been provided to you solely for information purposes and does not constitute an offer or solicitation of an offer or any advice or recommendation to purchase any securities or other financial instruments and may not be construed as such. The factual information set forth herein has been obtained or derived from sources believed by the author and IDX Insights, LLC (“IDX”) to be reliable but it is not necessarily all–inclusive and is not guaranteed as to its accuracy and is not to be regarded as a representation or warranty, express or implied, as to the information’s accuracy or completeness, nor should the attached information serve as the basis of any investment decision. This document is intended exclusively for the use of the person to whom it has been delivered by IDX, and it is not to be reproduced or redistributed to any other person. The information set forth herein has been provided to you as secondary information and should not be the primary source for any investment or allocation decision. Information contained herein has been obtained from sources believed to be reliable, but not guaranteed. Forward-looking statements are not guarantees of future results. They involve risks, uncertainties and assumptions, there can be no assurance that actual results will not differ materially from expectations. Past performance is no guarantee of future results. No part of this material may be reproduced in any form, or referred to in any other publication, without express written permission from IDX. The information contained herein is only as current as of the date indicated, and may be superseded by subsequent market events or for other reasons. Charts and graphs provided herein are for illustrative purposes only. The information in this document has been developed internally and/or obtained from sources believed to be reliable; however, neither IDX nor the author guarantees the accuracy, adequacy or completeness of such information. Nothing contained herein constitutes investment, legal, tax or other advice nor is it to be relied on in making an investment or other decision. There can be no assurance that an investment strategy will be successful. Historic market trends are not reliable indicators of actual future market behavior or future performance of any particular investment which may differ materially, and should not be relied upon as such. This document should not be viewed as a current or past recommendation or a solicitation of an offer to buy or sell any securities or to adopt any investment strategy. The investment strategy and themes discussed herein may be unsuitable for investors depending on their specific investment objectives and financial situation. IDX provide links to third-party websites contained herein only as a convenience and the inclusion of such links does not imply any endorsement, approval, investigation, verification or monitoring by us of any content or information contained within or accessible from the linked sites. If you choose to visit the linked sites you do so at your own risk, and you will be subject to such sites’ terms of use and privacy policies, over which IDX.com has no control. In no event will IDX be responsible for any information or content within the linked sites or your use of the linked sites. Information contained on third-party websites that IDX may link to is not reviewed in its entirety for accuracy and IDX assumes no liability for the information contained on these websites. It is not possible to invest directly in an index. Exposure to an asset class represented by an index may be available through investable instruments derived from that index. Wilshire makes no representations regarding the advisability of investing in investment products based on the Index, which is not sponsored, endorsed, sold or promoted by Wilshire. Index returns do not reflect payment of certain sales charges or fees an investor may pay to purchase the securities underlying the Index or investment vehicles intended to track the performance of the Index. The imposition of these fees and charges would cause actual performance of the securities/vehicles to be lower than the Index performance shown. IDX gives no representations or warranties as to the accuracy of such information, and accepts no responsibility or liability (including for indirect, consequential or incidental damages) for any error, omission or inaccuracy in such information and for results obtained from its use. Information is as of the date indicated, and is subject to change without notice. This material is intended forinformational purposes only and should not be construed as legal, accounting, tax, investment, or other professional advice.
