originally published by Palladiem
Counting until it doesn’t count anymore
Whether is was the hope that lockdown would end soon and restart the economy, or the liquidity the Federal Reserve provided to Wall Street to save asset prices, the capital markets advanced again in May. The S&P 500 rose 4.76% after the 12.82% gain in April. The index value has risen over 36% from the March 23rd low. The index in now down less than 10% from the February 19th high close.
The Dow Jones Industrial Average has been the domestic laggard the last two months. The leader has been the NASDAQ. The DJIA has trailed the S&P 500, Mid-Cap, and Small-Cap index in the first two months of this quarter.
The NASDAQ rose 6.76% in May and 15.45% in April. The index is positive for 2020, rising 5.76% through May. In comparison, the S&P 500 remains negative at -4.97% through May, while the DJIA is -10.06% YTD
Non-US stocks lag the US market since the market recovery began. MSCI EAFE rose 4.75% in May after the 6.46% gain in April. YTD the EAFE index remains negative -14.26%. MSCI Emerging Markets barely rose in May, up just 0.77%. EM is down -15.96% YTD. The low, or minimum volatility strategies that aided investors in the month long panic selling are lagging the market recovery as expected. The MSCI ACWI Minimum Volatility index rose just 2.21% in May. YTD the index strategy has added 146 basis points over the MSCI ACWI total index
The price of gold began to recover before the equity market. Gold’s price bottomed on March 16 at $1494.18. By May 18, the price had risen to $1792.70, a gain of 20%. Bitcoin’s price bottomed during the panic on March 17. From that date to May 8th, Bitcoin rose from $5331.72 to $9917.25, a gain of 86%. Commodity indices bounced back in May after April lows. The S&P GSCI rose 16.4% in the month. Over one-half the commodity index is comprised of the Energy complex. The complex rose 35.2%, led by the recovery of oil off its disastrous lows
High yield bond indices led the fixed income indices as the Fed buying actually began.
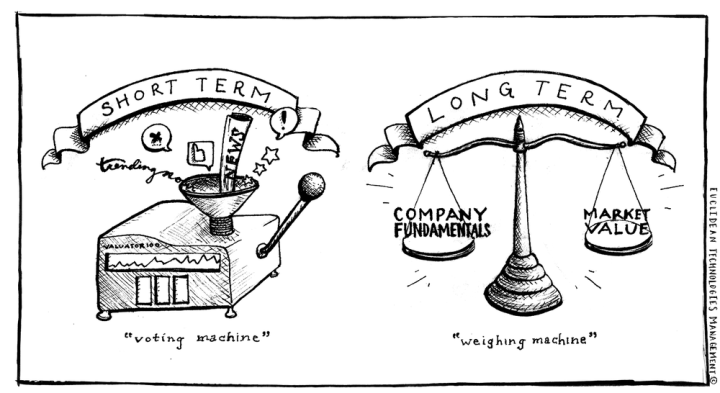
Ben Graham famously posited “in the short-run the market is a voting machine, in the long-run a weighing machine”. He also said, “My books have probably been read and disregarded by more people than any book on finance that I know of”. The conflict off short-run data, emotion, and psychology versus the relevance and substance of long-term assets and cash flow is the fundamental structure of capital markets. There is more counting than weighing in the markets now. What are we counting?

The 12-month eps forecast is the shorthand to justify the current value of the market or a company. The collapse of eps forecasts has forced the use of the 24 month forecast. At the beginning of 2020, the S&P 500 EPS was $175.52 per share. At that EPS forecast, the market began the year with an 18PE, an above average forecast with little room for downward revisions.
By the end of March, and only a beginning hint to the earnings damage the shutdown would incur, S&P 500 EPS forecasts was down to $151.52. The current estimate is $109.93 (and that’s based on a 2nd half of the year recovery). With the -37.4% drop in earnings forecast for 2020, the current PE of the market is almost 28X.
For investors to have some belief that equities offer a potential fair risk/reward, the focus has shifted to 24-month (2021) earnings, historically a notoriously unpredictable number this far out. The 2021 eps forecast on March 31, 2020 was $183.37 per share for the S&P 500. That number has been reduced to $162.14 in two months, a -14% decline. The S&P 500 currently sells at 18.8X 2021 EPS, more expensive than we began 2020.
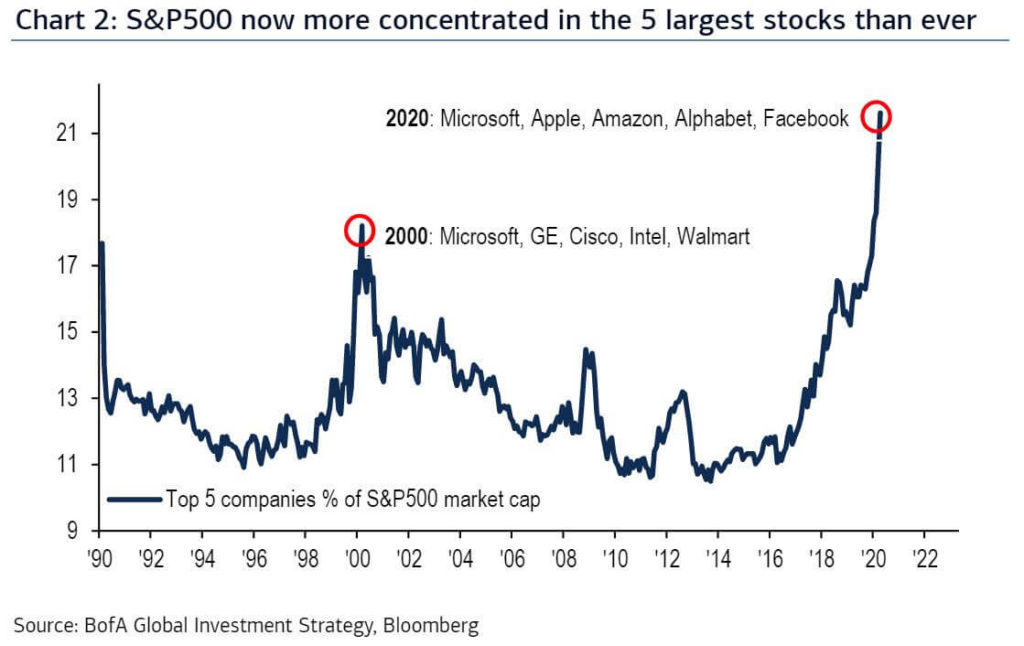
Equity markets have never been this concentrated in the largest companies. The ten largest stocks in the S&P 500 are now worth over $6.5 trillion, or 25.8% of the total value of the S&P 500. These ten stocks are worth more the entire US small-cap market (the Ru2000) and similar to the entire Emerging Markets. The top 5 companies (Microsoft, Apple, Amazon, Alphabet, and Facebook) now account for a record 20.3% of the total value of the S&P 500. This surpasses the concentration during the Internet bubble peak when Microsoft, GE, Cisco, Intel, and Walmart accounted for 19% of the market. GE has fallen almost -90% from that period.

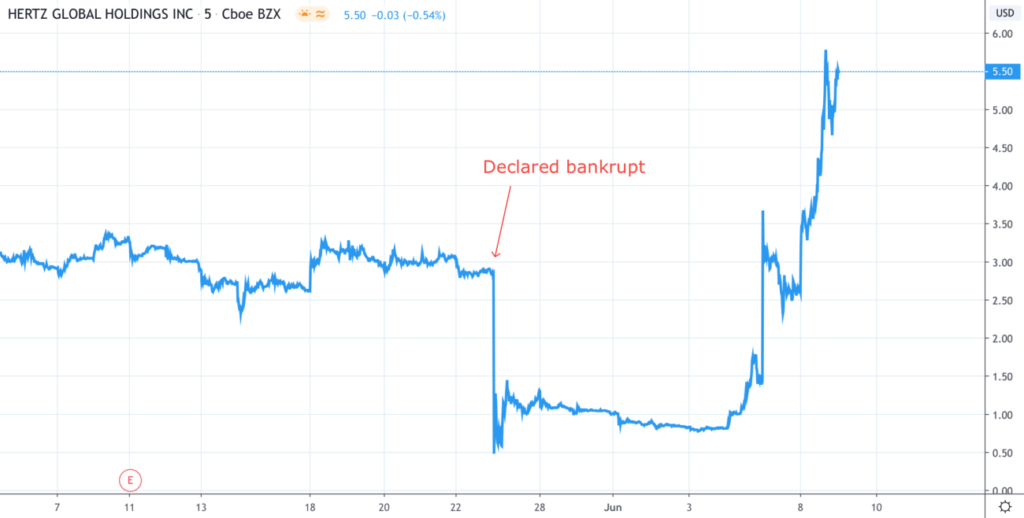
The NASDAQ total market value now exceeds the aggregate value of developed markets MSCI World index ex the US. Retail and institutional hedge funds have agreed on one strategy, overweight the dominant largest and tech stocks. While both groups of investors are using the same long mega-tech stock strategy, they differ on the what else completes the portfolio. The reward to the focused mega tech strategy has led speculative retail investors to become large traders and investors in fallen angels such as the bankruptcy of Hertz. Vegas style playing with the house money gains is leading to excess risks strategies so close to the recent collapse of capital markets.

What began as a seller of cheap books has morphed into the largest and cheapest seller of corporate debt ever. Oversold by billions, Amazon added to the trillion dollars in corporate bonds sold in 2020. Amazon sold $10 billion in varying maturities at the lowest corporate yields ever offered at most maturities. Of course Amazon doesn’t need the money except to repurchase and manage shares outstanding. The markets appetite for corporate debt remains unabated as long as the Fed stands with an open ended willingness to buy if necessary.
The markets are counting on the Fed policy as one of the reasons to focus farther out into the future to justify recent price changes and the concentrated excess returns. To be determined is whether all the risks were weighed properly.
Important Disclosures
The statements contained herein are based upon the opinions of Palladiem LLC (Palladiem) and the data available at the
time of publication and are subject to change at any time without notice. This communication does not constitute
investment advice and is for informational purposes only, is not intended to meet the objectives or suitability
requirements of any specific individual or account, and does not provide a guarantee that the investment objective of any
model will be met. An investor should assess his/her own investment needs based on his/her own financial circumstances
and investment objectives. Neither the information nor any opinions expressed herein should be construed as a
solicitation or a recommendation by Palladiem or its affiliates to buy or sell any securities or investments or hire any
specific manager.
Palladiem prepared this Update utilizing information from a variety of sources that it believes to be reliable that may
include, but not be limited to, custodians, mutual fund companies, investment managers, Morningstar, Bloomberg, other
third‐party service providers and in some cases as directed by the client or their representative. Palladiem takes
reasonable care to ensure the accuracy of such information but does not warrant that it is complete, accurate or adequate
and it should not be relied upon as such.
It is important to remember that there are risks inherent in any investment and that there is no assurance that any
investment, asset class, style or index will provide positive performance over time. Diversification and strategic asset
allocation do not guarantee a profit or protect against a loss in a declining markets. Past performance is not a guarantee of
future results. All investments are subject to risk, including the loss of principal. Portfolio positions referenced are subject
to change at any time, your portfolio may not reflect the information referenced.
Palladiem has sole discretion to change allocations to styles and vehicles at any time.
Index definitions:
“U.S. Large Cap” represented by the S&P 500 Index.
“U.S. Small Cap” represented by the Russell 2000 Index.
“International” represented by the MSCI Europe, Australasia, Far East (EAFE) Net Return Index.
“Emerging” represented by the MSCI Emerging Markets Net Return Index.
“U.S. Aggregate” represented by the Bloomberg Barclays U.S. Aggregate Bond Index.
“U.S. Government” represented by the Bloomberg Barclays U.S. Government Bond Index.
“U.S. Corporate” represented by the Bloomberg Barclays U.S. Credit Bond Index.
“U.S. High Yield” represented by the Bloomberg Barclays U.S. Corporate High Yield Index.
“Non‐U.S. Developed” represented by the S&P International Treasury ex U.S. Index.
“Emerging Market Debt” represented by the JP Morgan GBI‐EM Global Core Index
“REITs” represented by the FTSE North American Real Estate Investment Trust (REIT) Equity REITs Index.
“Commodities” represented by the Dow Jones Commodity Index .
“Managed Futures” represented by the Credit Suisse Managed Futures Index.
“Global Macro” represented by the Credit Suisse Global Macro Index
Palladiem, LLC is a Registered Investment Adviser.
For more information about Palladiem, as well as its products, fees and services, please refer to Palladiem’s website,
www.palladiem.com or call us at 888‐886‐4122; 610‐304‐6529
